Allocating Scarce Medicaid OffersAllocating Scarce Medicaid Offers
Lottery, Need-Based, and Learned Targeting in the Oregon Health Insurance Experiment
In 2008, Oregon used a lottery to decide which low-income adults could apply for Medicaid, creating a randomized experiment in public insurance. This project asks a question the lottery did not: if a program can only offer coverage to half of its waiting list, who should receive the offer? Using the Oregon Health Insurance Experiment public-use data, the lottery's effect on medical debt is replicated with four estimators, a cross-fitted causal forest tests whether the effect differs across people, and five allocation rules (lottery, need-based, risk-based, benefit-based, universal) are compared under a fixed budget using doubly robust evaluation. Winning the lottery reduced the medical debt rate by 5.2 percentage points. Targeting improved on the lottery by about one percentage point at best, and a simple need-based rule using prior SNAP/TANF participation captured most of that gain without any machine learning, given the information available at sign-up.
Introduction
Medicaid is rationed. Enrollment caps, waiting lists, and waiver programs mean that in some states and periods, eligible people do not all receive coverage, and some mechanism decides who does1. Oregon's 2008 lottery is the clearest case: roughly 90,000 people signed up for about 10,000 openings in the OHP Standard program, and the state drew names at random2. The lottery made the Oregon Health Insurance Experiment (OHIE) possible, and its first-year results showed that coverage increased health care use, reduced financial strain, and improved self-reported health2.
A lottery is fair in one sense, since everyone has the same chance, but it is not obviously the best use of a scarce offer. A program could instead prioritize people with the greatest need, people at the highest risk of the outcome it cares about, or people predicted to benefit most from coverage. Each of these rules reaches a different population, and each depends on a different kind of information. Prediction-based and effect-based targeting have become common proposals in health policy and the policy learning literature3,4, but how much they improve on simpler rules in practice, with the information a program has at allocation time, is less clear.
This project uses the OHIE to compare allocation rules on a single outcome, owing money for medical expenses 12 months after the lottery. Because the lottery was random, the effect of an offer can be estimated for everyone on the list, and because the data include pre-lottery characteristics, each rule can be simulated and evaluated against what would have happened under the others. The project also asks who each rule reaches, since a rule that averts more debt by excluding a group is a different policy from one that does not.
Data
The analysis uses the OHIE public-use files released by the National Bureau of Economic Research5: descriptive variables from the lottery sign-up list, state program records, and the 12-month mail survey. The three files were merged on person ID and restricted to the 23,741 people who responded to the 12-month survey, out of 74,922 on the lottery list.
The outcome is a binary indicator for currently owing money for medical expenses at 12 months. Three secondary outcomes capture related financial strain: borrowing money or skipping bills to pay medical bills, being refused care because of past debt, and any out-of-pocket medical spending. Predictors are the 15 characteristics recorded on the sign-up form or in state records before the lottery: age, sex, English-language preference, self versus household sign-up, phone number provided, PO box address, metropolitan ZIP code, sign-up week and first- or last-day sign-up, and prior SNAP and TANF participation and benefit amounts. One predictor was dropped as a near-duplicate of another (Spearman correlation 0.999).
Two features of the design shape every analysis. Households with more members had more lottery entries, and the survey was mailed in waves tied to the lottery drawings, so the chance of winning varied from 35% to 92% across household-size by wave cells. Survey weights supplied with the data were applied so that estimates reflect the full lottery list rather than respondents alone, and all standard errors were clustered by household, since selection was at the household level.
Methods
The analysis has four stages, each feeding the next.
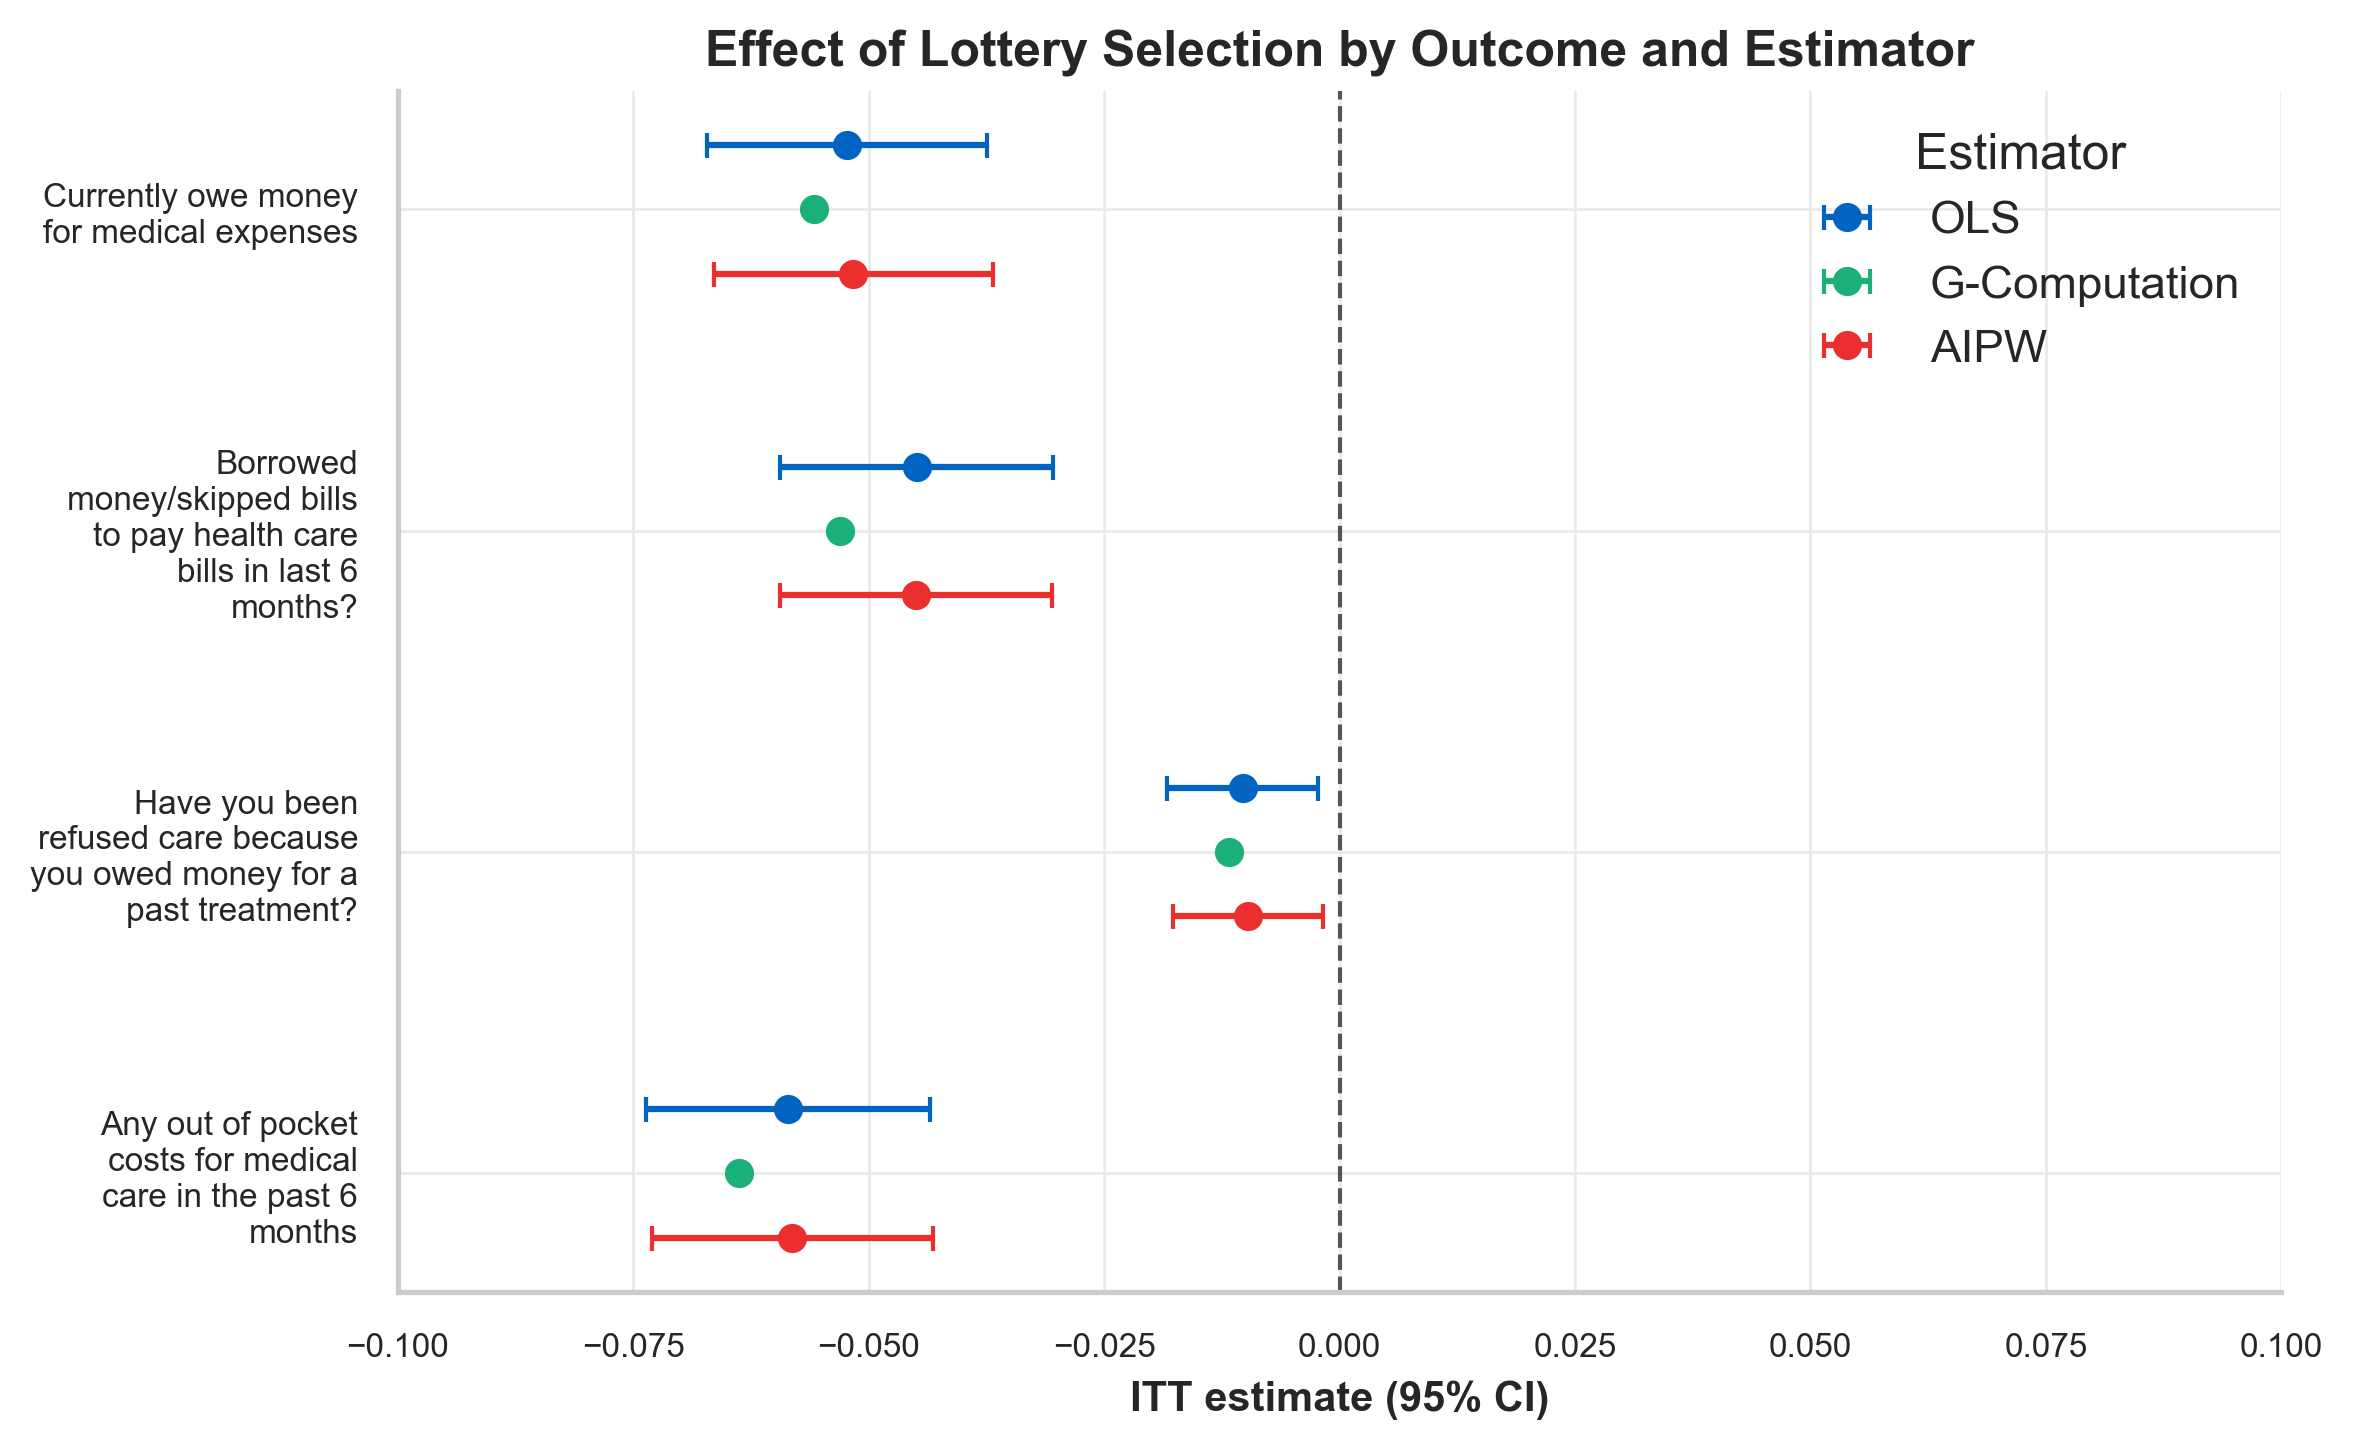
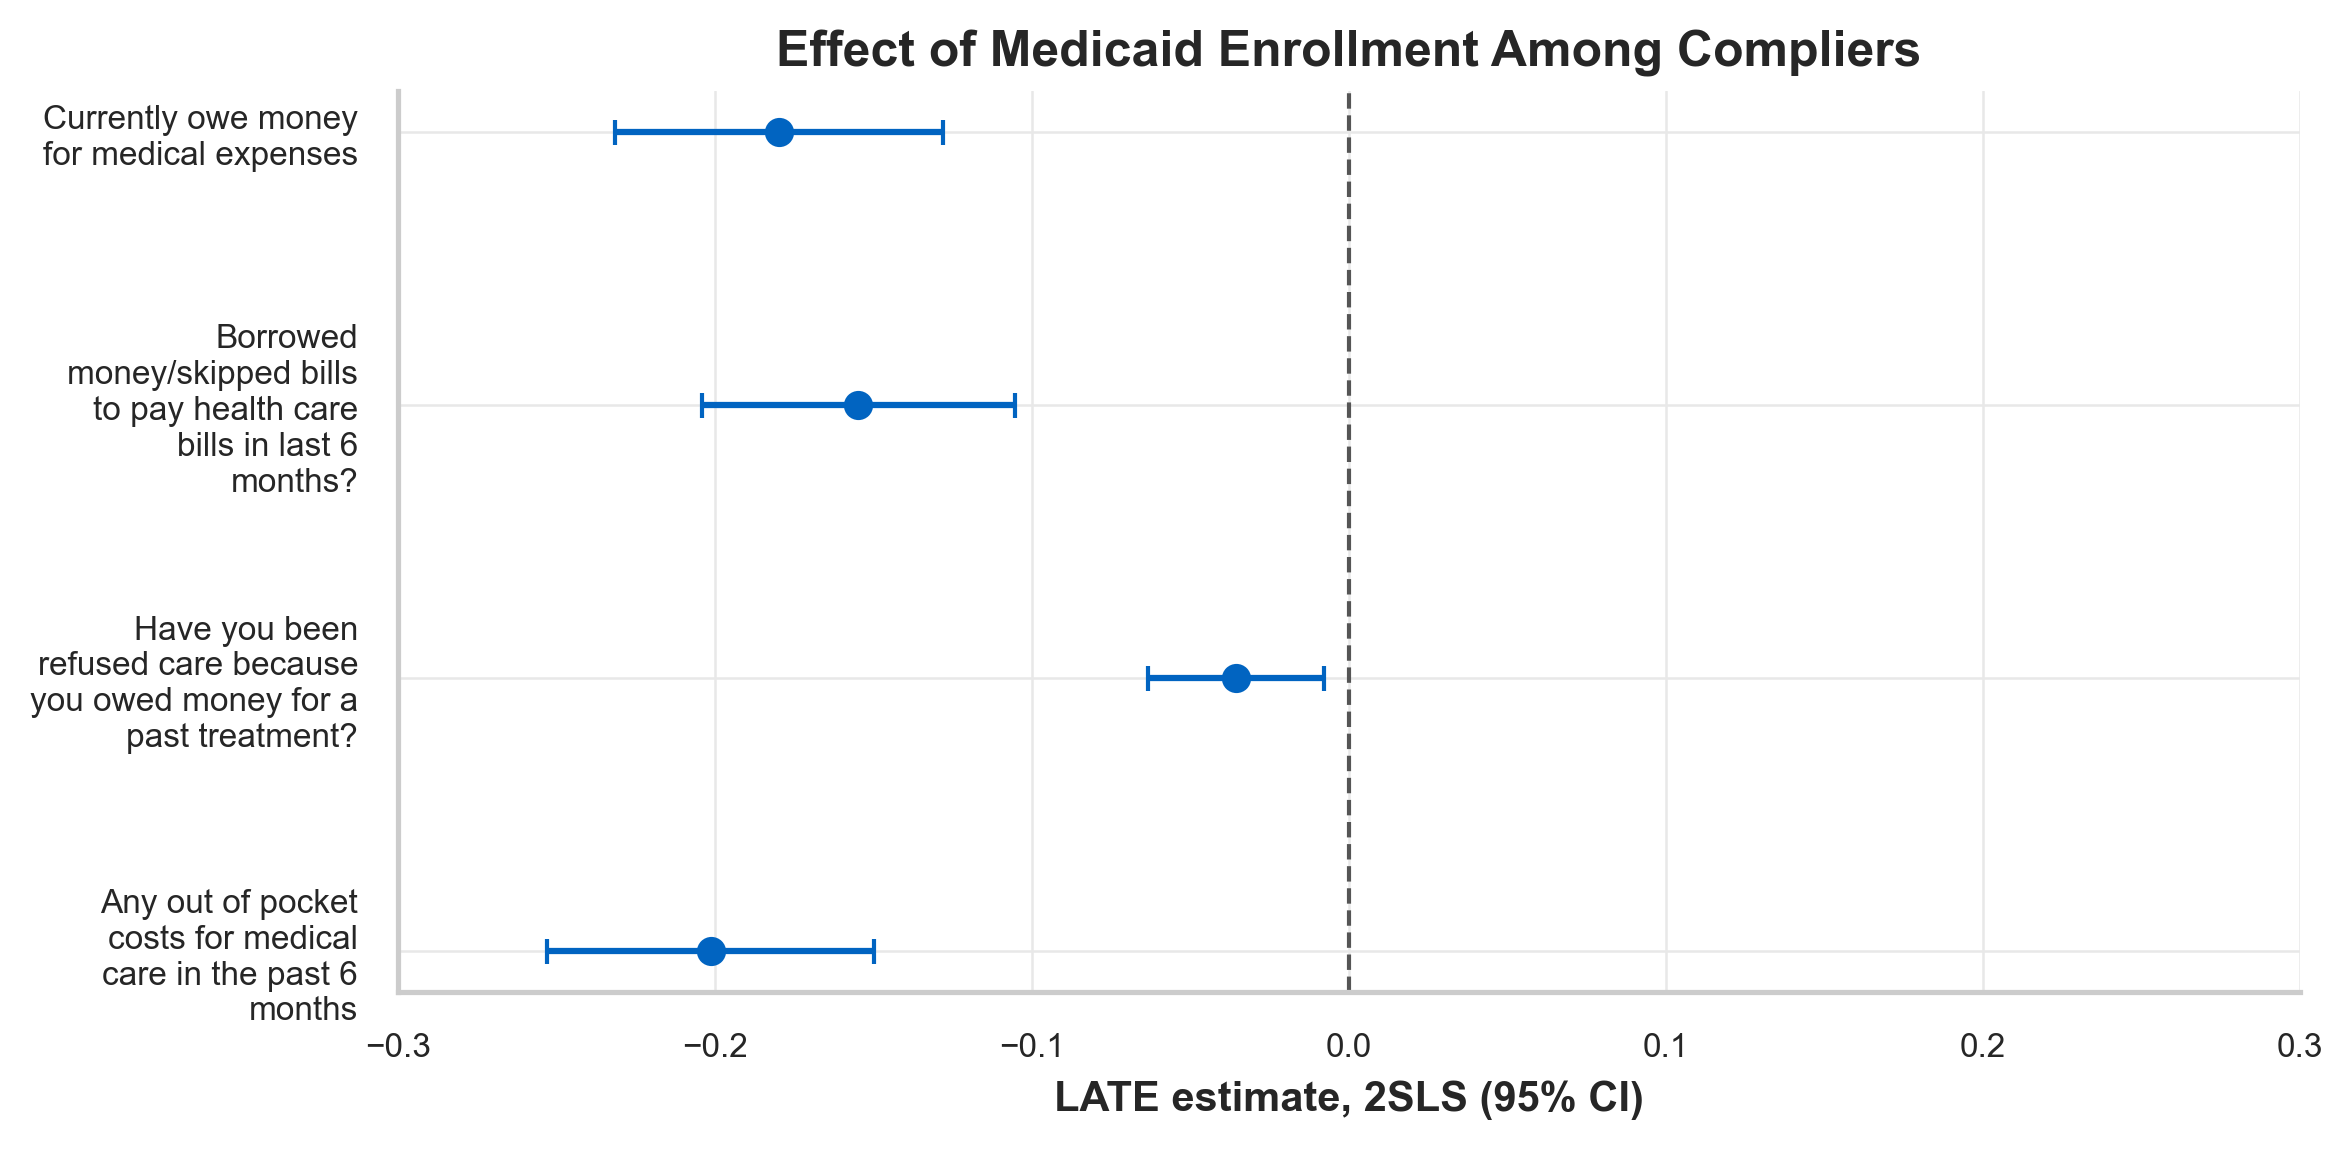
The lottery effect. The intention-to-treat effect of a lottery offer was estimated by weighted least squares with fixed effects for each household-size by wave cell, matching the specification in Finkelstein et al.2, and checked against the published estimate. The same effect was then estimated three more ways: by two-stage least squares, which uses the lottery as an instrument for enrollment and recovers the effect of coverage itself among compliers; by g-computation, which fits an outcome model in each arm and averages the predicted difference; and by augmented inverse probability weighting (AIPW), which combines the outcome models with the design propensity score and is consistent if either is correct6,7. The propensity score is known from the design, as the weighted share of each cell that won, so AIPW does not depend on a treatment model. The outcome models were XGBoost classifiers, cross-fitted on household-grouped folds so that no person's prediction came from a model that saw their household.
Who is at risk. Logistic regression, random forest, and XGBoost were trained to predict medical debt from the pre-lottery predictors, tuned by random search on the same household-grouped folds and compared on Brier score, AUC, and calibration. Their out-of-fold predictions supplied the risk score for the risk-based allocation rule.
Who benefits. A causal forest8,10, cross-fitted on the same folds with honest trees, estimated a conditional average treatment effect for each person. Because a flexible model can report heterogeneity that is not there, the forest's predictions were tested against the AIPW scores with a calibration regression and sorted group treatment effects9, and compared with prespecified subgroups by age, sex, language, and prior program participation. The forest's predictions supplied the benefit score for the benefit-based rule.
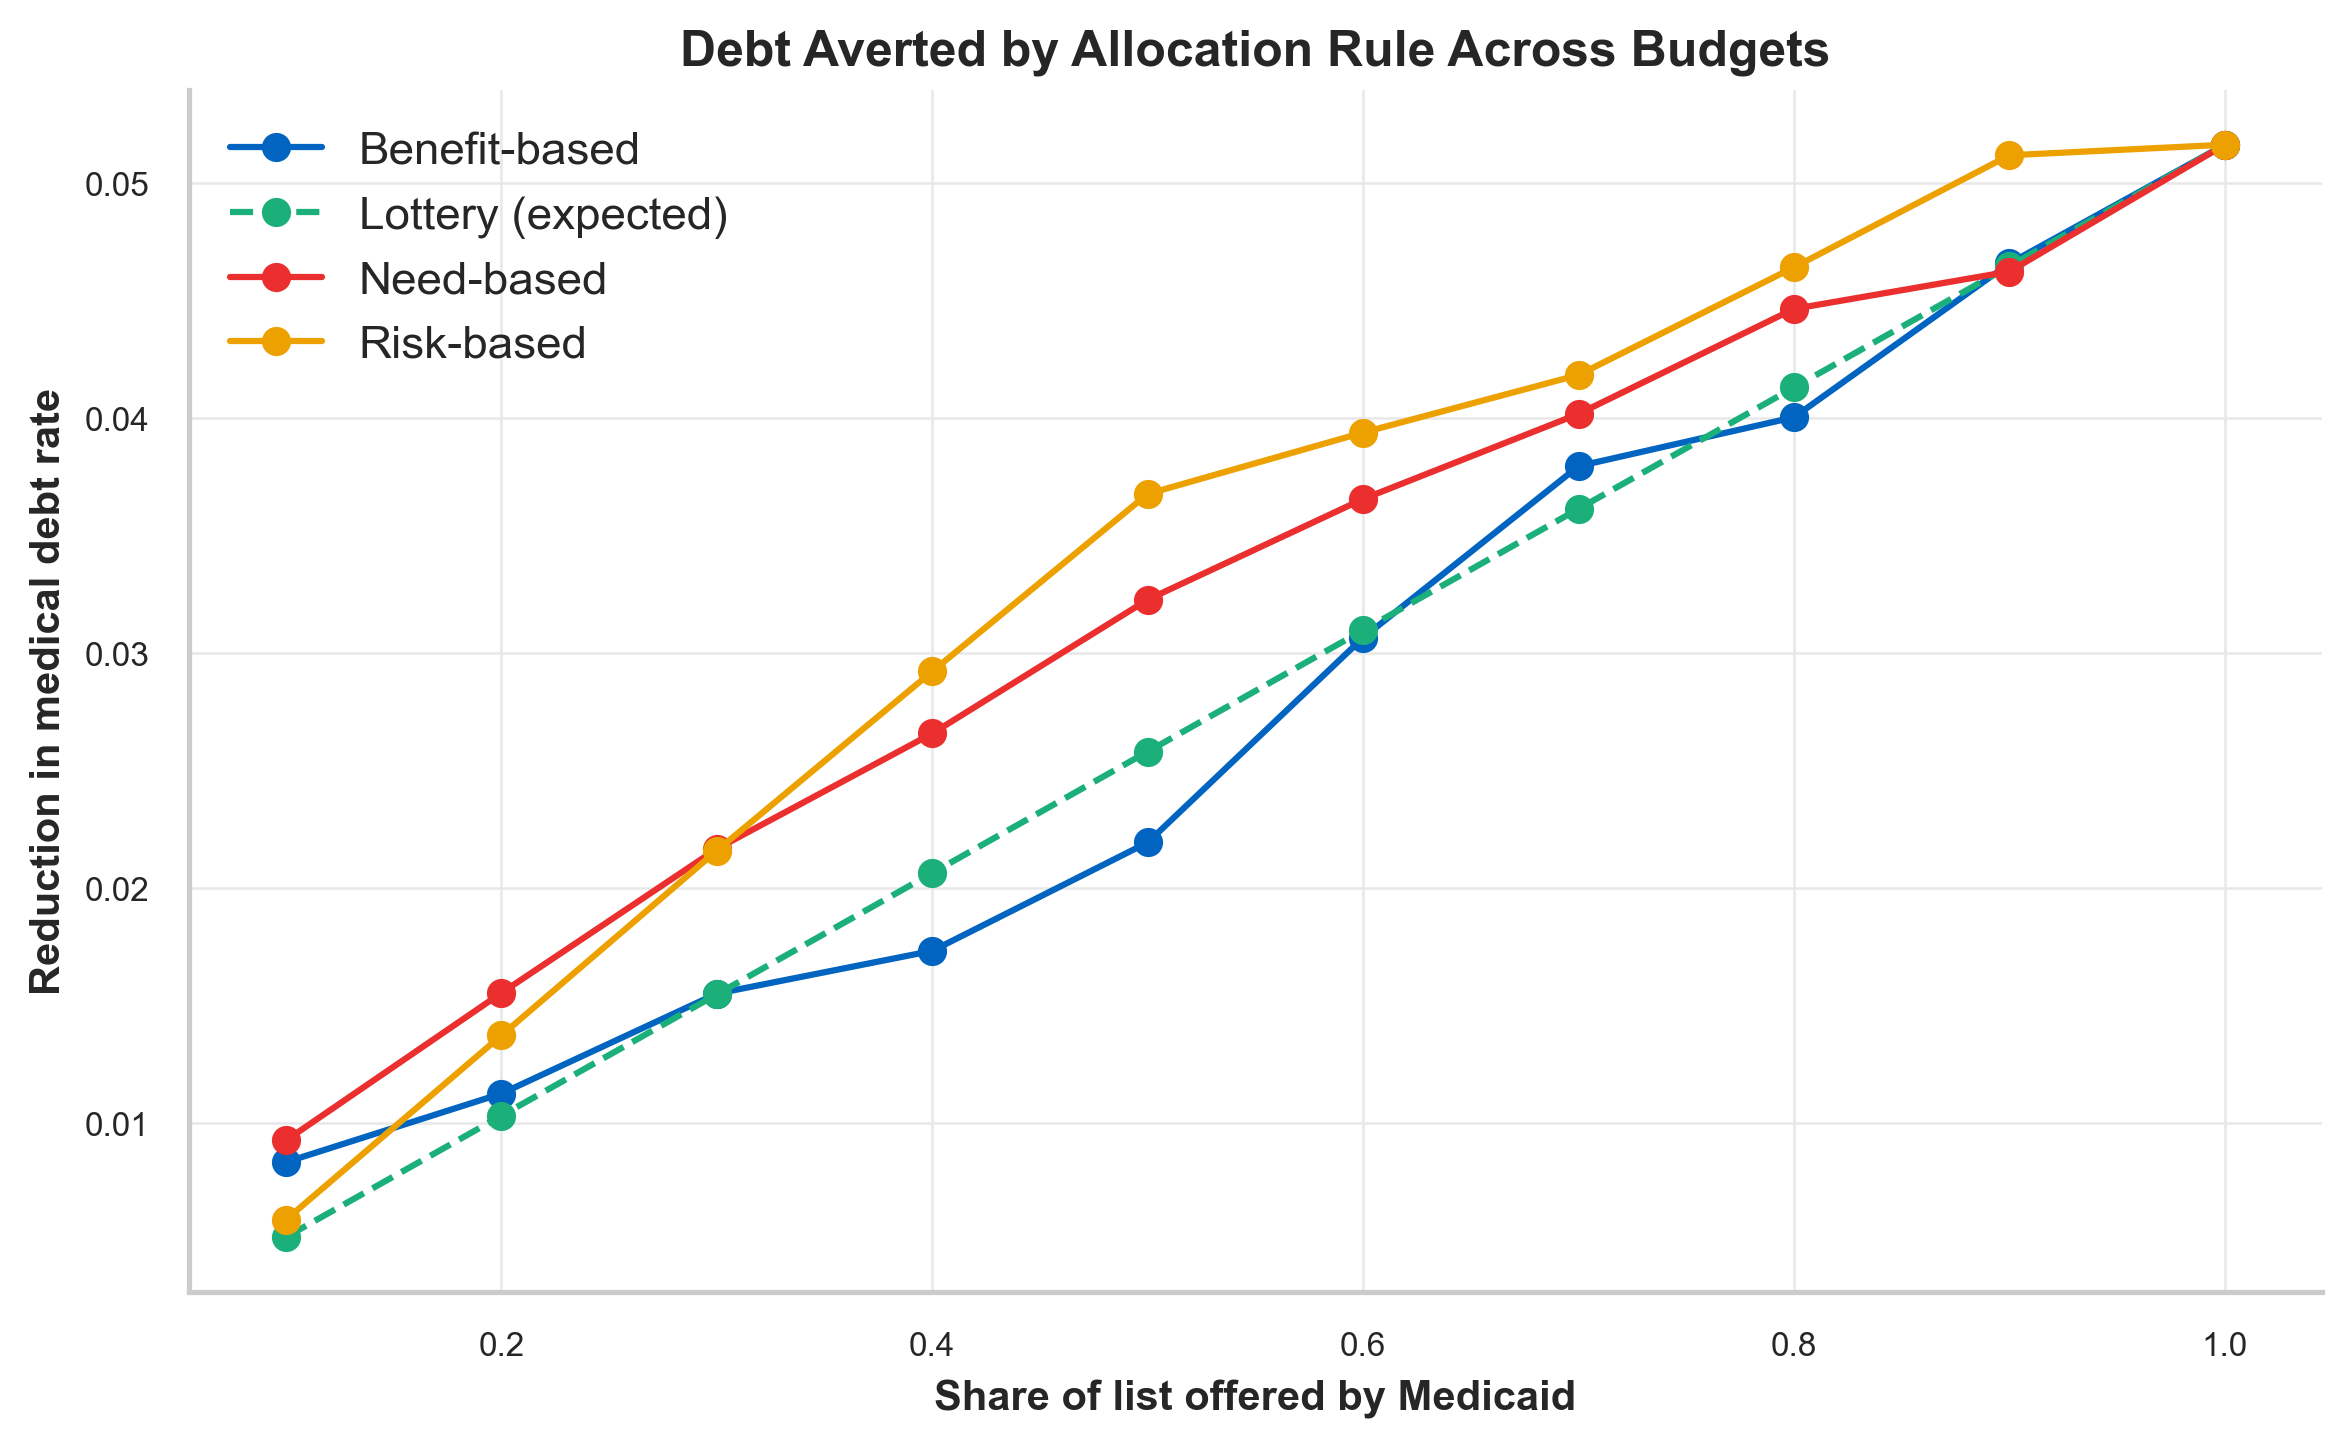
Who should get the offer. The budget was fixed at the share of the list the actual lottery offered. Five rules were compared: the lottery, need-based (ranked by prior SNAP/TANF benefit dollars), risk-based (ranked by predicted debt probability), benefit-based (ranked by predicted treatment effect), and universal coverage as a ceiling. Each rule's value is the medical debt it would avert relative to offering no one, estimated by averaging the AIPW scores under the rule's assignment3,4, with a g-computation cross-check. Uncertainty came from a household bootstrap, the comparison was repeated across budgets from 10% to 90%, and the subgroup composition of each rule's offers was compared against the list.
Results
Winning the lottery reduced the probability of owing money for medical expenses at 12 months by 5.2 percentage points (SE 0.8), from 59.7% among non-winners to 53.8% among winners, in line with the published OHIE estimate. Weighted OLS, g-computation, and AIPW agreed within 0.1 percentage point. The three secondary outcomes moved the same way. Only 29% of winners enrolled, so among compliers the effect of coverage itself was 18.0 percentage points.
Pre-lottery characteristics predicted medical debt weakly. All three classifiers reached an AUC of about 0.60 with well-calibrated probabilities and Brier scores within 0.001 of each other. Prior SNAP participation, English-language preference, and sex were the strongest predictors. The limitation is the data, not the models: the sign-up form records little about health, income, or prior medical use.
The causal forest found no reliable heterogeneity. Its predicted effects ranged from -18 to +5 percentage points, but the calibration test could not distinguish that spread from noise (coefficient 0.01, p = 0.98), and the actual effect within each predicted-effect quintile ranged from -3 to -7 points in no particular order. Prespecified subgroups told a similar story: the effect was somewhat larger for prior SNAP/TANF participants (-6.7 vs -3.4 points, p = 0.03) and near zero for non-English speakers, with neither surviving a multiple-comparison correction.
At the lottery's 50% budget, risk-based allocation averted 3.7 percentage points of medical debt, need-based 3.2, the lottery 2.6, and benefit-based 2.2, against a ceiling of 5.2 if everyone were offered. The risk-based gain over the lottery of 1.1 points was statistically distinguishable from zero (95% CI 0.4 to 1.8); the need-based gain of 0.6 was borderline (95% CI -0.1 to 1.4) but held at every budget from 10% to 80%, and need-based led at budgets up to 30% before risk-based took over. Benefit-based targeting was never distinguishable from the lottery, which follows from the forest finding nothing to target.
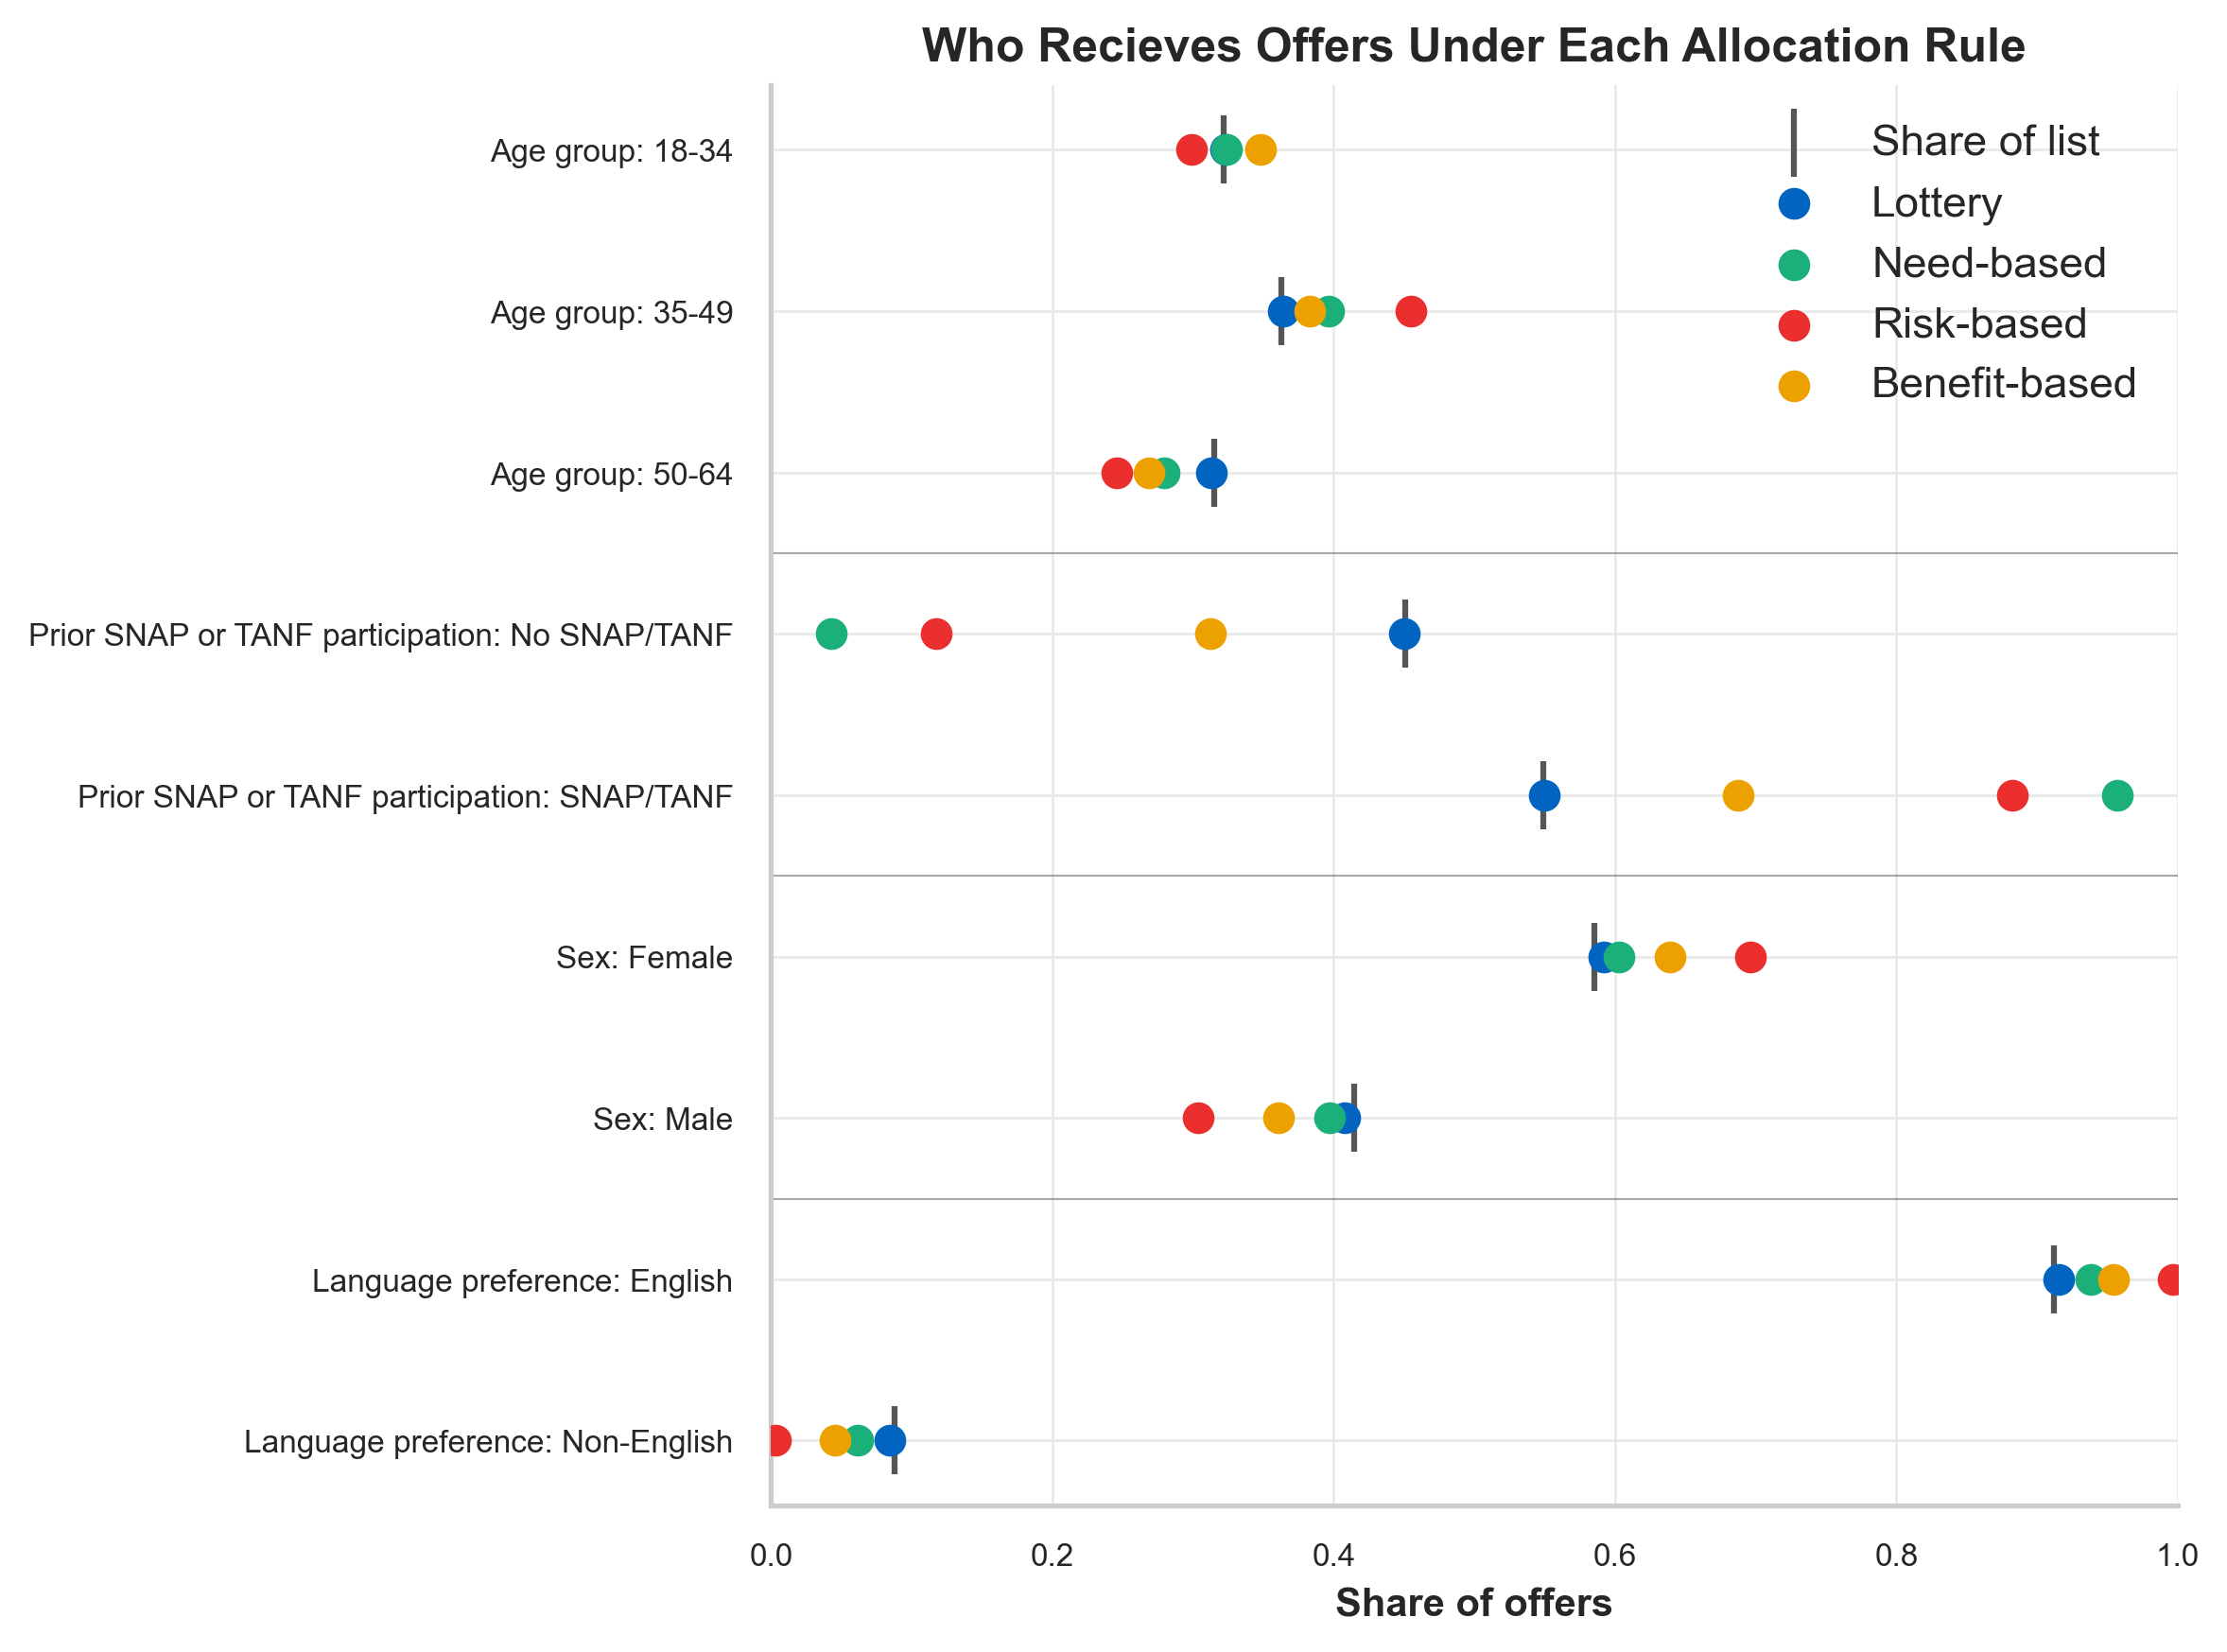
The gains came with distributional shifts. Need-based allocation sent 96% of offers to prior SNAP/TANF participants, and risk-based 88%, against 55% of the list. Risk-based allocation sent 70% of offers to women and 0.3% to non-English speakers, who make up 8.8% of the list, because the risk model learned that English-language preference predicts debt. A rule that averts half a point more debt than need-based does so partly by excluding nearly every non-English speaker, a different policy from the lottery whatever its average effect.
Limitations
The comparison is conditional on the information a program has at sign-up. The lottery list records demographics, sign-up behavior, and prior program participation, and nothing about health, income, or prior medical use. Richer data would likely improve the risk score and might reveal heterogeneity the forest could not find here. The result is therefore a statement about targeting with sign-up information, which is the realistic case, not about targeting in general.
The budget is in offers, but the mechanism is enrollment. Only 29% of winners enrolled, so each rule's averted debt depends on who takes up coverage as well as who is offered it; a rule that reaches people more likely to enroll would look better, and this was not modeled. About 41% of those mailed the 12-month survey responded, which the survey weights address but do not eliminate as a source of bias. The gains from targeting are small in absolute terms, and the need-based rule's interval includes zero at the main budget.
Conclusions
With the information available at sign-up, a program allocating scarce Medicaid offers in Oregon could have averted about one percentage point more medical debt than the lottery by targeting on predicted risk, and about half of that by the far simpler rule of prioritizing prior SNAP/TANF participants. Effect-based targeting added nothing, because the effect of coverage did not detectably differ across people. The ceiling was universal coverage: no allocation rule recovered more than about 70% of what offering everyone would have.
The more useful lesson may be about what targeting costs. The rule that averted the most debt also concentrated offers on particular groups and nearly excluded non-English speakers, a consequence the average effect does not show. Any program weighing targeting against a lottery needs the distributional analysis alongside the efficiency one. A declined offer costs the program nothing, so raising enrollment among those already offered may matter as much as changing who is offered, which is the natural next question for this data.
The project uses the public-use data from the Oregon Health Insurance Experiment, made available by the National Bureau of Economic Research (NBER). Finkelstein, Amy. Oregon Health Insurance Experiment Public Use Data, 2013. Available at https://www.nber.org/research/data/oregon-health-insurance-experiment-data.
References
- 1.Allen, H., Baicker, K., Finkelstein, A., Taubman, S., & Wright, B. J. (2010). What the Oregon Health Study can tell us about expanding Medicaid. Health Affairs, 29(8), 1498–1506. ↗ link
- 2.Finkelstein, A., Taubman, S., Wright, B., Bernstein, M., Gruber, J., Newhouse, J. P., Allen, H., Baicker, K., & Oregon Health Study Group. (2012). The Oregon Health Insurance Experiment: Evidence from the first year. Quarterly Journal of Economics, 127(3), 1057–1106. ↗ link
- 3.Kitagawa, T., & Tetenov, A. (2018). Who should be treated? Empirical welfare maximization methods for treatment choice. Econometrica, 86(2), 591–616. ↗ link
- 4.Athey, S., & Wager, S. (2021). Policy learning with observational data. Econometrica, 89(1), 133–161. ↗ link
- 5.Finkelstein, A. (2013). Oregon Health Insurance Experiment Public Use Data. National Bureau of Economic Research. ↗ link
- 6.Rosenbaum, P. R., & Rubin, D. B. (1983). The central role of the propensity score in observational studies for causal effects. Biometrika, 70(1), 41–55. ↗ link
- 7.Robins, J. M., Rotnitzky, A., & Zhao, L. P. (1994). Estimation of regression coefficients when some regressors are not always observed. Journal of the American Statistical Association, 89(427), 846–866. ↗ link
- 8.Wager, S., & Athey, S. (2018). Estimation and inference of heterogeneous treatment effects using random forests. Journal of the American Statistical Association, 113(523), 1228–1242. ↗ link
- 9.Chernozhukov, V., Demirer, M., Duflo, E., & Fernández-Val, I. (2018). Generic machine learning inference on heterogeneous treatment effects in randomized experiments. NBER Working Paper 24678. ↗ link
- 10.Battocchi, K., Dillon, E., Hei, M., Lewis, G., Oka, P., Oprescu, M., & Syrgkanis, V. (2019). EconML: A Python package for ML-based heterogeneous treatment effect estimation. ↗ link