MRSA in the COVID-19 Era: Trends, Policies, and Public Health Implications
An Interrupted Time Series Analysis with State Fixed Effects
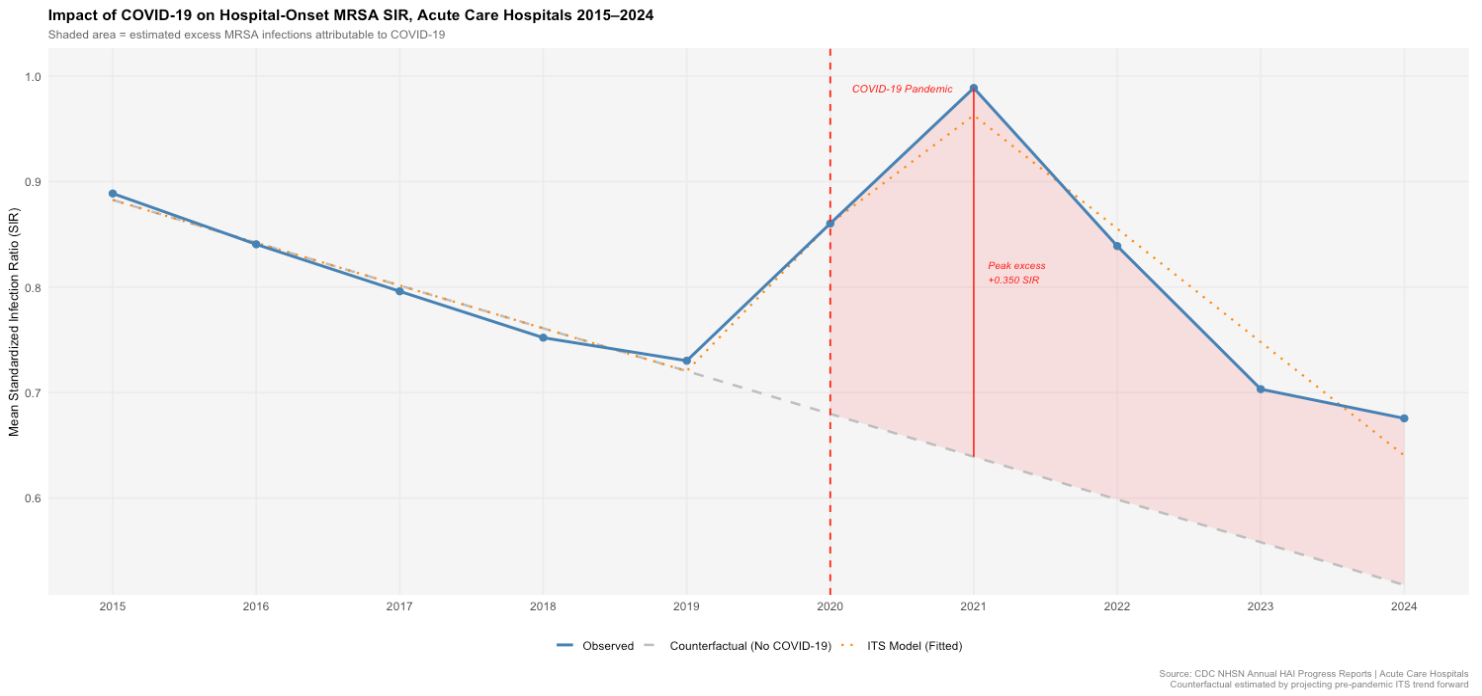
Hospital-onset MRSA infections had been declining steadily across U.S. acute care hospitals for nearly a decade before COVID-19 reversed that trend. Using interrupted time series with state fixed effects on a ten-year national panel, we estimate that the pandemic produced a peak excess of 0.35 SIR units above the pre-pandemic trajectory by 2021, with rates remaining elevated through 2024. State-level policy analysis suggests school closures were associated with smaller MRSA spikes, while poverty rate was the only demographic factor with a statistically significant independent association with infection burden.
Introduction
Methicillin-resistant Staphylococcus aureus (MRSA) is one of the most consequential healthcare-associated infections in the United States, generating excess mortality, prolonged hospitalizations, and substantial downstream costs. Prior to 2020, sustained national progress on hospital-onset MRSA had been one of the clearer wins in infection control policy, driven by improved surveillance, hand hygiene protocols, and contact precautions. COVID-19 dismantled much of the infrastructure that supported those gains. ICU surges, staffing shortages, increased device utilization, and disrupted infection control routines created conditions that were likely to accelerate MRSA transmission, but quantifying that disruption rigorously required separating pandemic-era increases from the pre-existing trend.
The central research question was: how much did COVID-19 elevate hospital-onset MRSA above what would have been expected absent the pandemic? A secondary question asked whether the substantial variation in state-level COVID-19 restriction policies was associated with differential MRSA outcomes, after adjusting for key demographic and socioeconomic risk factors. The CDC NHSN dataset is well-suited to this question. It provides standardized infection ratios for all 50 states across a decade, capturing both the pre-pandemic decline and the pandemic disruption with consistent measurement methodology.
Data
The primary dataset is the CDC NHSN Annual HAI Progress Reports, covering 2015–2024 across four facility types: acute care hospitals (ACH), critical access hospitals (CAH), inpatient rehabilitation facilities (IRF), and long-term acute care hospitals (LTACH). The primary outcome is the Standardized Infection Ratio (SIR), the ratio of observed to predicted MRSA infections given a facility's patient mix. Primary analysis was restricted to ACH because the other three facility types had high SIR missingness across years; ACH data were complete across all 50 states and all 10 years.
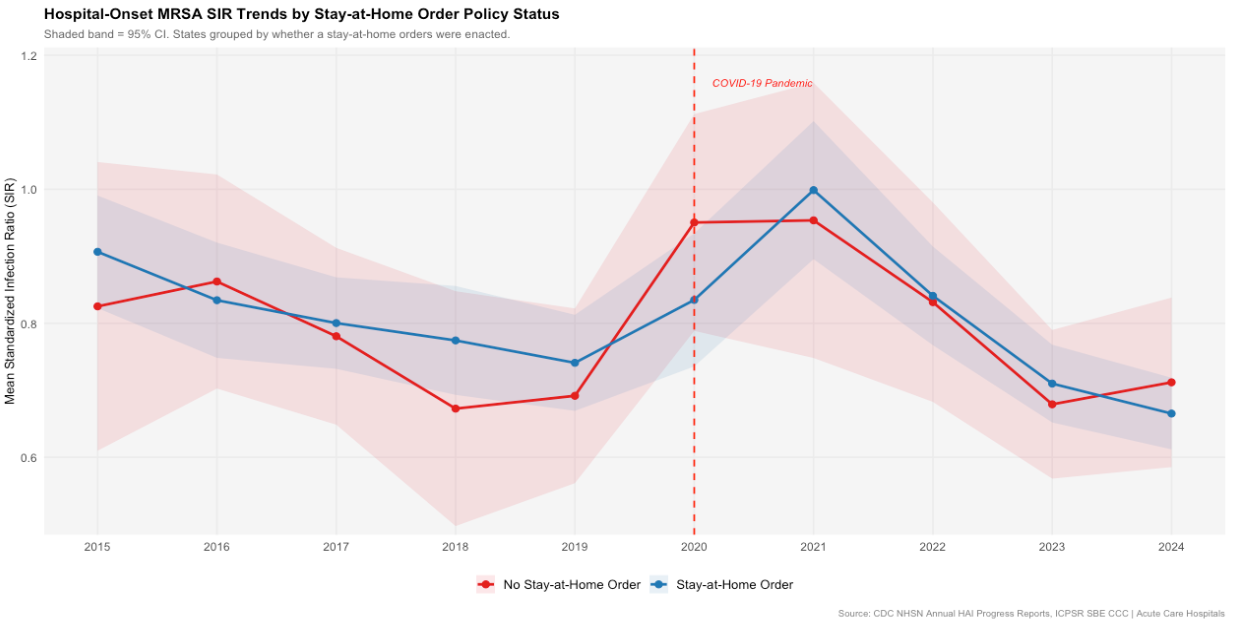
State-level COVID-19 policy indicators came from the ICPSR SBE CCC dataset and were coded as binary variables indicating whether each of five policies was ever enacted:
- ·Business closures
- ·Stay-at-home orders
- ·School closures
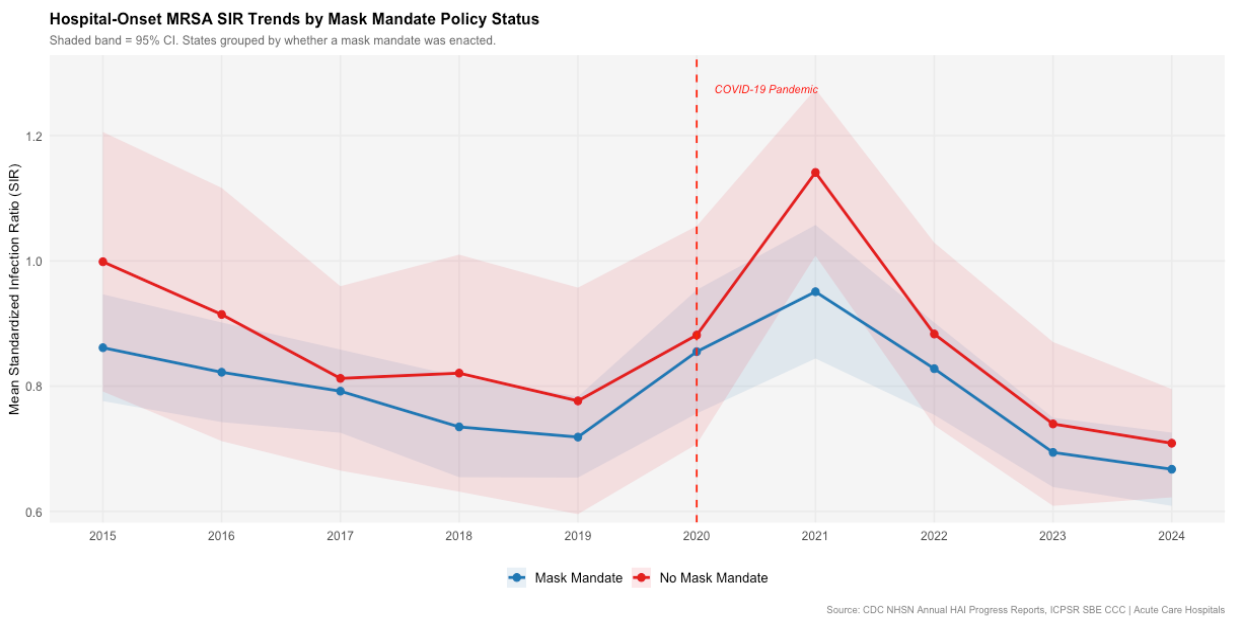
- ·Mask mandates
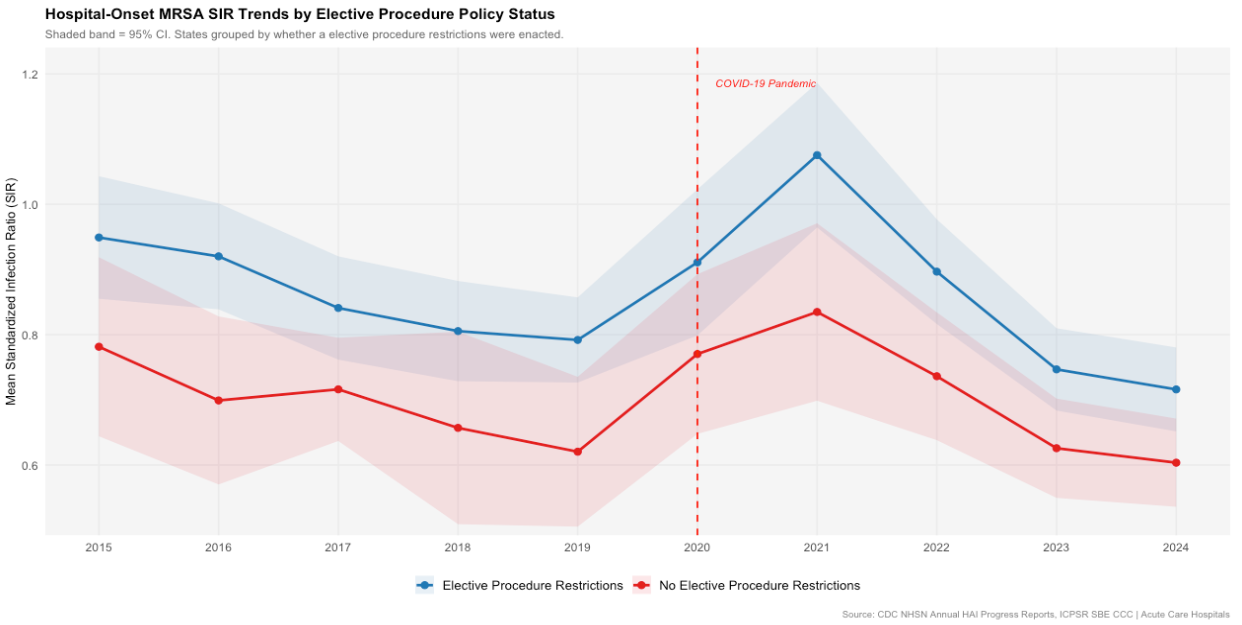
- ·Elective procedure restrictions
A composite stringency score (0–5) was also constructed. Demographic covariates, specifically the percentage of residents living in poverty and the percentage aged 65 or older, came from ACS 1-year estimates via tidycensus. Because the ACS 1-year survey was not conducted in 2020, both variables were linearly interpolated for that year using the 2019 and 2021 estimates.
Methods
The primary estimator is interrupted time series (ITS) with state fixed effects, fit using fixest::feols with standard errors clustered at the state level. The model takes the form:
SIR ~ time + post_2020 + post_2021 + time_post | state
State fixed effects · Standard errors clustered at the state level
Here time captures the linear pre-pandemic trend, post_2020 is an indicator for the 2020 transition year, post_2021 flags the post-intervention period, and time_post estimates slope change after the intervention. A weighted version used each state's predicted infection count as weights, giving higher-volume states proportionally more influence on the national estimate.
Because no U.S. state was unaffected by COVID-19, a traditional treatment-control design was not feasible. Each state serves as its own control, and identification rests on the assumption that the pre-pandemic linear trend would have continued absent the shock.
For the policy analysis, the ITS framework was extended by adding post-2021 interactions between each binary policy indicator and the SIR, along with demographic covariates, comparing differences across states rather than within them.
Results
Prior to COVID-19, ACH MRSA SIR declined at approximately -0.045 units per year (p < 0.001). The pandemic produced a sharp upward disruption: the 2020 transition year showed a level shift of +0.189 SIR units, and by 2021 the estimated post-pandemic level shift reached +0.819 units above the pre-pandemic trajectory (p < 2×10⁻¹⁶). The counterfactual comparison places the 2021 peak excess at 0.350 SIR units, a 54.7% increase above projected rates. After 2021, rates recovered at roughly twice the pre-pandemic pace, but remained elevated above the counterfactual through 2024.
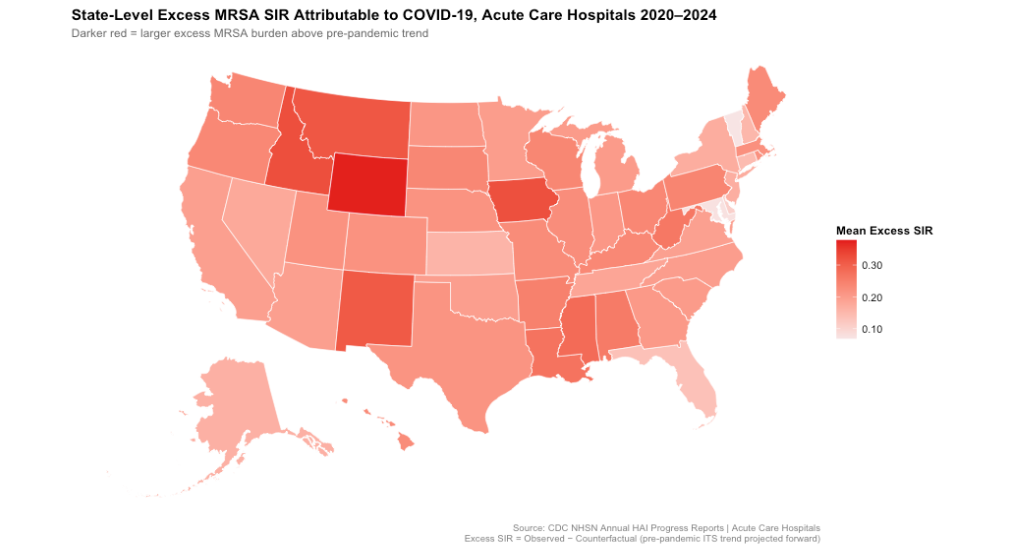
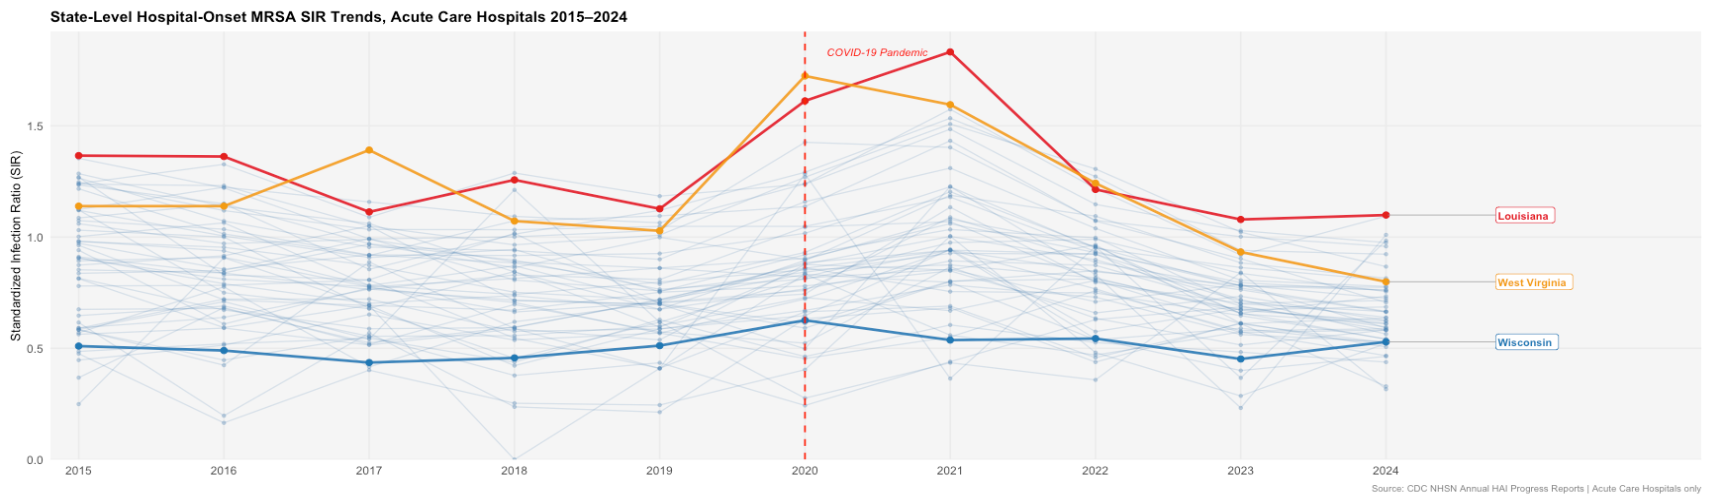
Geographic heterogeneity was substantial. Wyoming, Idaho, and Montana showed the highest mean excess SIR over the 2020–2024 period; Vermont, Maryland, and Delaware showed the lowest.
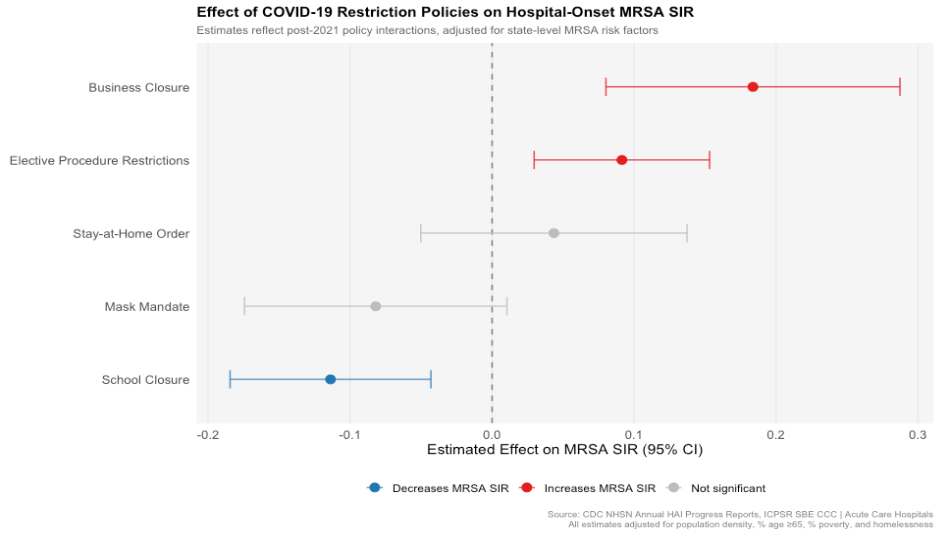
In the policy model, school closures were associated with a significantly smaller post-pandemic MRSA spike (-0.114 units, p = 0.003), while business closures (+0.184 units, p = 0.001) and elective procedure restrictions (+0.091 units, p = 0.006) were associated with larger spikes. Mask mandates showed a borderline protective association (-0.082, p = 0.088). Among demographic covariates, poverty was the only statistically significant predictor: each one percentage point increase in the state poverty rate was associated with a 0.052 unit increase in MRSA SIR, independent of policies and time.
Limitations
The most significant threat to validity is that the counterfactual projection rests on only five years of pre-period data and assumes the pre-pandemic linear trend would have continued undisturbed. Annual data provide limited resolution around the intervention timing, and the model cannot distinguish a 2020 level shift from a gradual acceleration that peaked in 2020.
The policy analysis faces a reverse causality problem: states with the most severe COVID-19 outbreaks were also likely to enact the strictest policies and experience the worst MRSA outcomes, which means positive coefficients on business closures and elective restrictions almost certainly reflect outbreak severity rather than policy harm. Binary policy coding further oversimplifies real-world implementation, which varied in timing, enforcement, and duration.
Finally, the analysis omits facility-level data, chronic disease burden, and healthcare system capacity variables that likely explain a meaningful share of the state-level variation.
Conclusions
COVID-19 produced a large, measurable, and persistent disruption to hospital-onset MRSA trends in U.S. acute care hospitals, adding an estimated 0.35 SIR units above projections at peak and leaving rates elevated above the counterfactual through 2024. The finding that poverty is the most robust demographic predictor of infection burden, independent of policy context, points toward structural drivers that infection control policy alone cannot address.
The policy associations, while not causal, are consistent with the hypothesis that community transmission mitigation influenced healthcare-associated infection dynamics. Disentangling those mechanisms requires richer time-varying policy data and facility-level analysis. Future work should incorporate time-varying policy exposure, extend analysis to CAH and LTACH as data quality improves, and consider healthcare system strain indicators such as ICU occupancy and nurse staffing ratios as potential mediators of the pandemic effect.