Annual Health Review
A Survey-Weighted Descriptive Analysis of U.S. Population Health Using NHANES
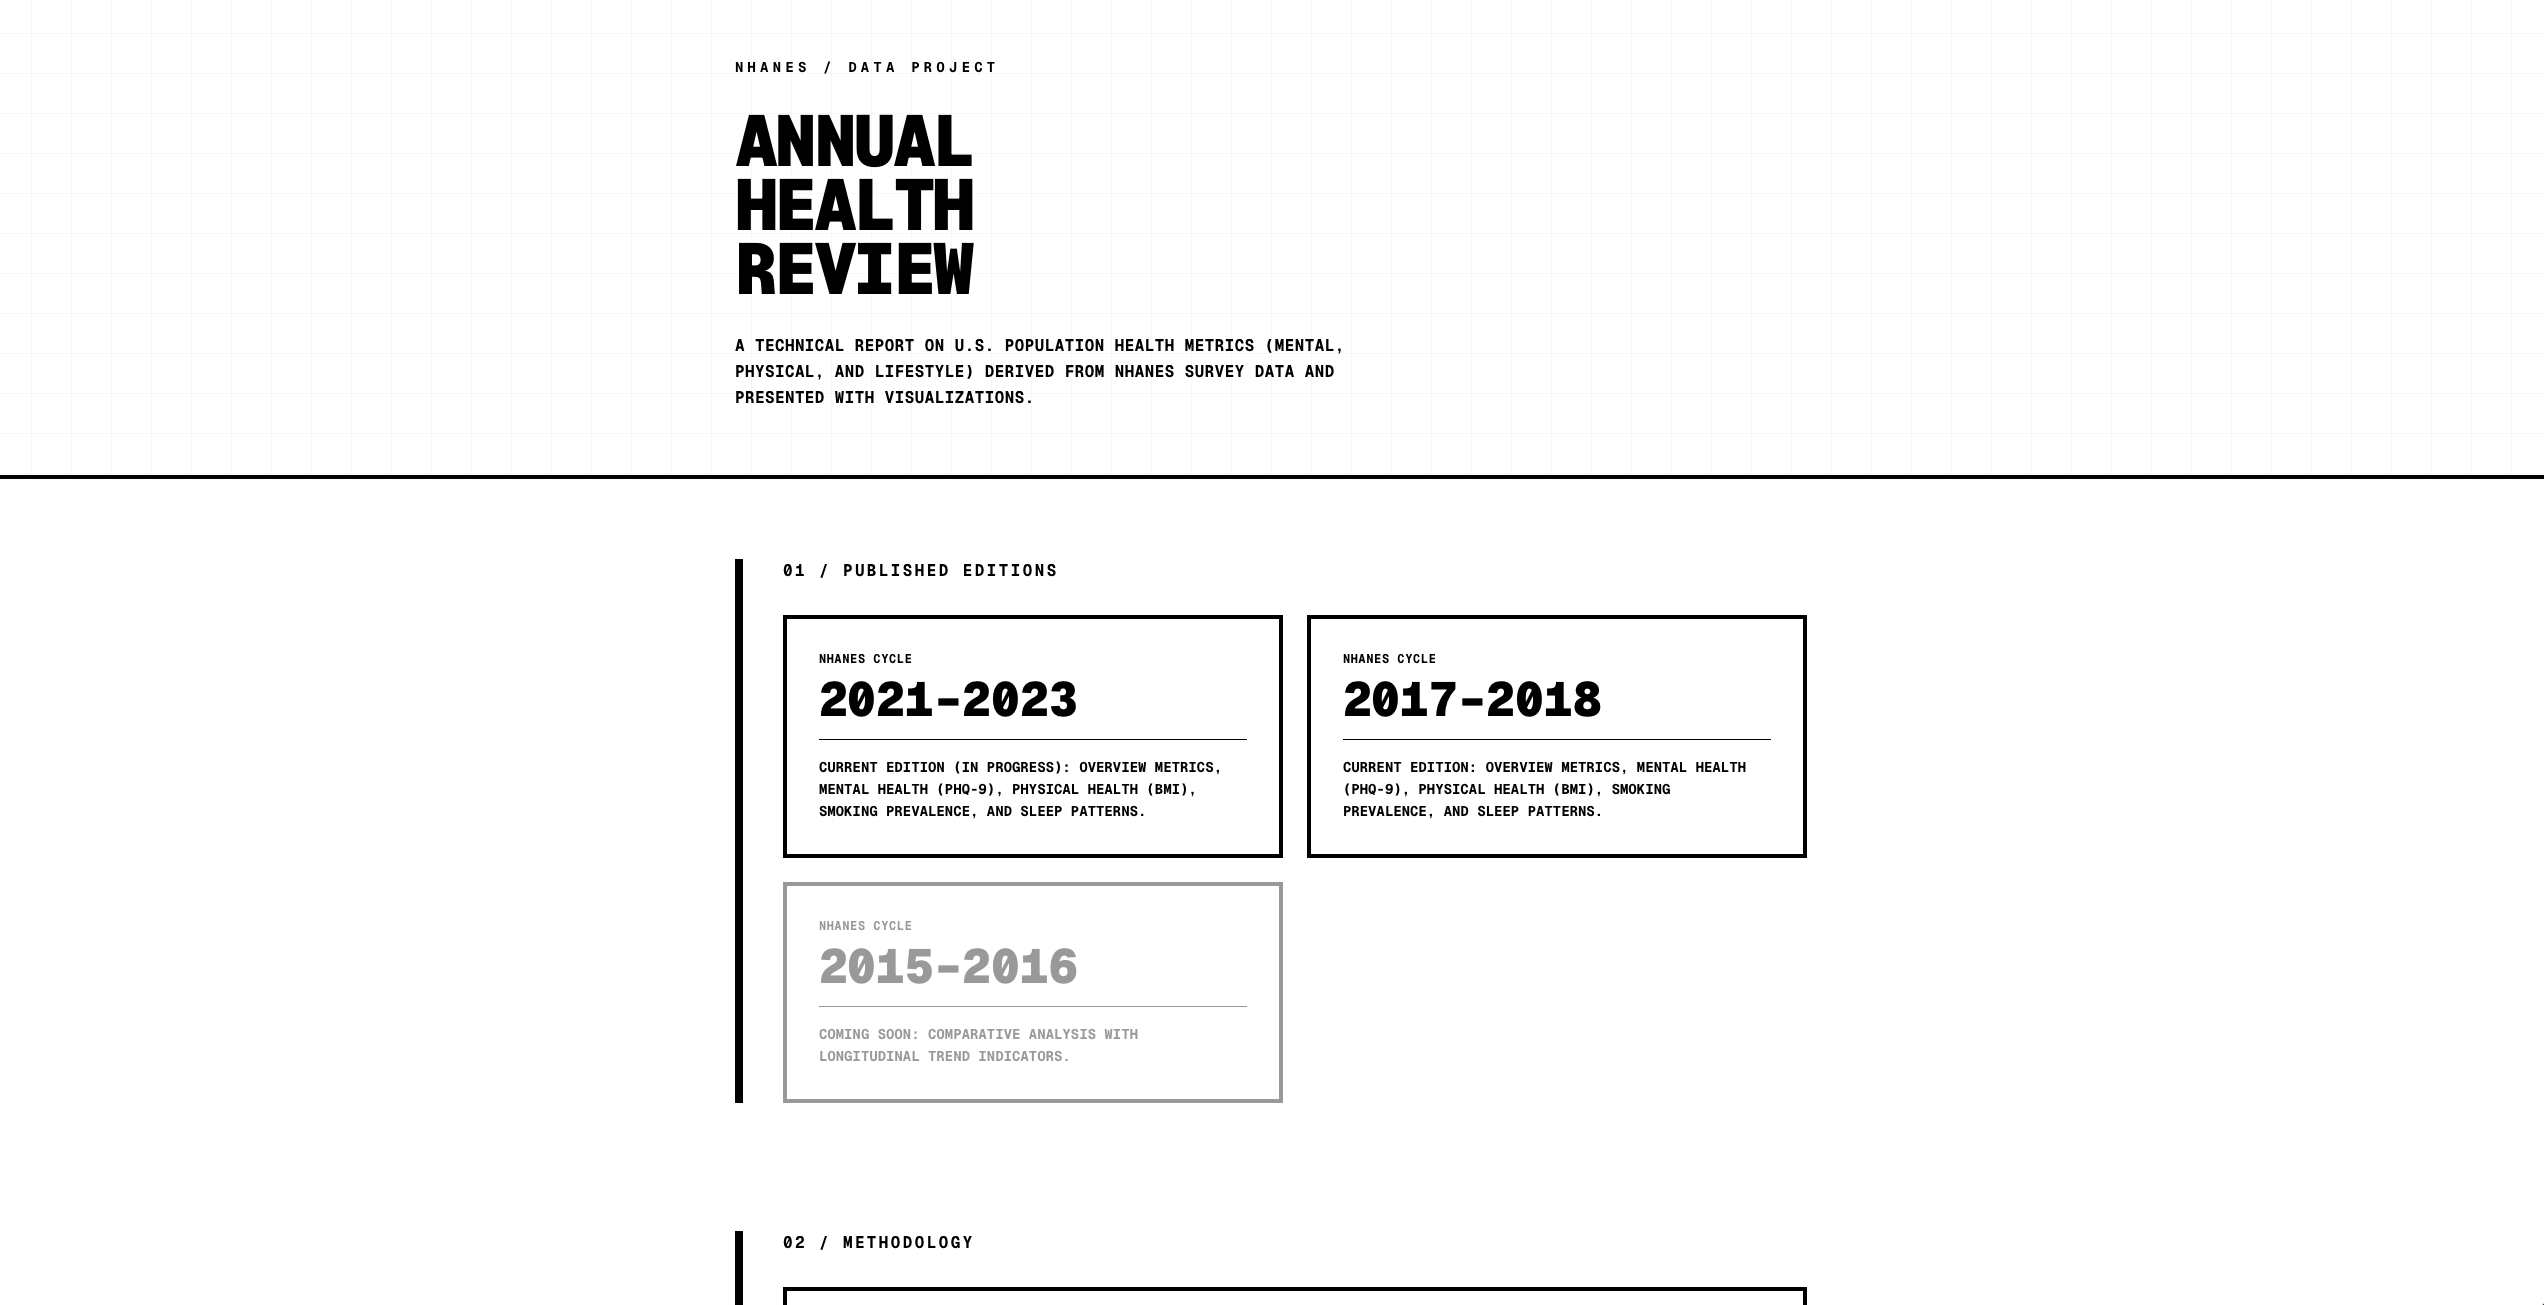
This project builds an interactive, survey-weighted platform using NHANES data to summarize the state of mental, physical, and behavioral health in the United States. The system integrates a reproducible data pipeline with a web-based reporting interface, translating raw survey microdata into interpretable population-level indicators. The initial edition focuses on 2021–2023 and 2017–2018 and provides a structured overview of depression burden, obesity prevalence, physical activity, smoking, and sleep. The long-term goal is to extend the platform into a multi-cycle health surveillance system that enables consistent comparisons across time and population subgroups.
Introduction
Understanding population health requires more than isolated metrics. Most public health dashboards present individual indicators such as obesity or smoking rates, but rarely integrate them into a cohesive, interpretable system. As a result, it is difficult to assess how behavioral, physical, and mental health risks co-occur across populations.
This project aims to address that gap by constructing a unified annual health overview using nationally representative survey data. The goal is not causal inference, but structured descriptive analysis that preserves methodological rigor while remaining interpretable.
What does a consistent, survey-weighted snapshot of U.S. health look like when key domains are measured and presented together?
NHANES provides a uniquely suitable setting for this work. It combines self-reported behavioral data with objectively measured health outcomes and uses a complex survey design to produce nationally representative estimates. This allows for a structured and comparable summary of multiple health domains within a single analytical framework.
Data
The analysis uses data from the National Health and Nutrition Examination Survey (NHANES), covering the 2017–2018 and 2021–2023 cycles. NHANES is a cross-sectional, nationally representative survey of the U.S. civilian non-institutionalized population. The unit of observation is the individual respondent, and the dataset integrates multiple modules including demographic data, questionnaire responses, and physical examination measures.
Key preprocessing steps include:
- ·Restricting the sample to adults aged 18 and older
- ·Cleaning missing, refused, and "don't know" responses using NHANES coding conventions
- ·Harmonizing variables across modules into a single analysis dataset
- ·Applying survey weights (WTMEC2YR) to produce population-level estimates
Key variables include:
- ·PHQ-9 depression scores (DPQ module)
- ·Body Mass Index from measured height and weight (BMX module)
- ·Physical activity from the PAQ questionnaire
- ·Smoking status from the SMQ module
- ·Sleep duration from SLQ variables
The final dataset is stored as a processed parquet file, which serves as the input for all downstream analyses and visualizations.
Methods
This project uses survey-weighted descriptive estimation to compute population-level proportions across demographic strata. Estimates are computed using a custom weighted proportions function, which calculates the weighted mean of indicator variables within age-by-sex groups. For binary outcomes, the estimator takes the form:
where wᵢ is the NHANES survey weight and yᵢ is the binary outcome indicator
Derived indicators include:
- ·Moderate-to-severe depression (PHQ-9 score of 10 or higher)
- ·Overweight or obese (BMI of 25 or higher)
- ·Current smoking status
- ·Short sleep (fewer than 7 hours)
- ·Physical activity guideline adherence (moderate-equivalent MVPA of 150 minutes or more per week)
Age groups are discretized into four categories: 18–29, 30–44, 45–64, and 65 and older. All results are stratified by sex and optionally aggregated to the full adult population.
The identification strategy is not causal. The design relies on the national representativeness of NHANES sampling, consistent measurement across domains, and structured aggregation to produce interpretable population summaries. The focus is on measurement consistency and comparability, not causal attribution.
Results
The 2021–2023 edition reveals consistent patterns across health domains. Depression prevalence is highest among younger adults and declines with age. Obesity prevalence increases steadily across age groups and remains elevated throughout middle and older adulthood. Behavioral risk factors such as smoking and short sleep show distinct age gradients, with peak prevalence occurring in early to mid-adulthood.
Physical activity adherence remains low across all groups, with fewer than half of adults meeting recommended guidelines in most age categories. Together, these results highlight the coexistence of multiple health risks across the adult population, rather than isolated conditions.
Depression disproportionately affects young women, while working-age adults face the highest burden of lifestyle risk factors including smoking and inadequate sleep.
Limitations
This analysis is descriptive and does not support causal interpretation. All relationships reflect population-level associations rather than effects. Several measures rely on self-reported data, particularly physical activity and sleep, which introduces recall bias and measurement error. Physical activity estimates are especially sensitive to reporting variation and are simplified into threshold-based indicators.
The physical activity guideline indicator currently uses a simplified moderate-equivalent calculation and does not fully incorporate frequency data. This may introduce approximation error relative to official guideline definitions. Finally, the analysis is limited to a single NHANES cycle, which restricts temporal interpretation. Future work will extend this framework across multiple cycles.
Conclusions
This project demonstrates that a structured, survey-weighted system can provide a coherent and interpretable overview of population health across multiple domains. The key takeaway is that health risks do not occur in isolation. Patterns of obesity, depression, inactivity, and behavioral risk factors overlap and vary systematically across age groups.
From a policy perspective, this suggests that interventions targeting single risk factors may underestimate the broader context of population health. Future directions include:
- ·Expanding to multiple NHANES cycles for trend analysis
- ·Improving physical activity measurement using frequency-adjusted metrics
- ·Developing composite indicators to capture multi-risk burden
- ·Integrating causal inference methods to move beyond descriptive analysis
The long-term goal is to build a scalable, transparent platform for population health surveillance that bridges data analysis and public communication.